Showing posts with label nifty india. Show all posts

Tuesday, 5 July 2011

Are You watching this ?

The Indian Stock Market Enterprise has been continuously trying to open the markets way ahead of its league only to watch it come down with in a matter a minutes back to levels where it actually belongs.
We did a research on our top 5 indicators which generally signal a trend change cautioning investors that what may look gloomy is actually intriguing.
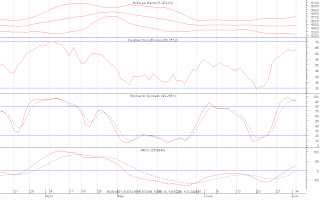
We added some more simpler explanations for readers to understand exactly what these mean
The RSI is now at 63.35 where 30 is considered a buying level and 70 a selling level.
The stochastic Oscillator is now at 90.25 where 80 is considered overbought and 20 oversold.
The MACD has NOT yet triggered the sell signal but is close and we do expect that to happen within the next 2 trading days.
The Bollinger bands as we can see are not giving a very clear picture of what we could expect but definitely seem to be closing in pretty fast.
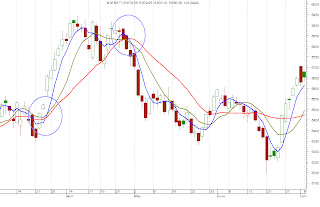
We also drew up a chart combining the 20-10-5 DMA. The chart has very simple rules
  1. When the 20 DMA crosses over the 10DMA & 5 DMA it means the market is losing momentum and losing steam. (look at circle 2 above May)
  2. When the 20 DMA goes under the 10 & 5 DMA it means the heat is building up and the bulls are taking charge. The market is rather gaining momentum quickly and its time to buy.
Combining these indicators for a previous period end april/ may start we see that
  • the Stochastics in April end / May peak was at 72, 
  • the 20 DMA crosses over the 10&5 DMA, 
  • the MACD  generated a sell signal 4 days before the trend changed and 
  • the RSI was at 65.

We had way too many signs of CAUTION and yet here we have it again. 


TimesNifty - July 5th 2011

Friday, 1 July 2011

RELIANCE INDUSTRIES TARGET MET

On the 20th of June we had posted an article on  RELIANCE INDUSTRIES "Make it OR Break it" (link)

Our first Target of 904 was met today - we had recommended the stock for the last run at 840-50 levels ! The stock hasn't moved quite at the pace as we had expected and with nifty touching our target of 5700 we have now  recommended our clients to sell for a lesser marginal profit.

NIFTY 4800 - "You can run but you cant hide "

On Thursday May 26th - we had worked to triangulate a situation of NIFTY hitting 4800
This was the situation as on 26th May.We had emphasised on these special points
  • Nifty should hit a high of 5690-5700 before starting to collapse again.
  • The wave structure is composed of 6 points before it breaks away.
  • We had expected 2 sets of 3 wave movements with an X wave in the middle and a high of 5690-5700

However Nifty did break the asymmetrical pattern, formed a head and shoulder pattern (cick on link) but within 3 trading sessions we were back in the symmetrical pattern. 


Nifty today morning has touched a high of 5705.8 but came back down very quickly. We expect a change in trend to start this coming week. Gann angels show a change in trend on the 6th of July but we could see consolidations as early as starting monday the 4th. 
These are safe positions where short positions can be assumed. We had mentioned earlier to watch very closely what Nifty does @ this stage. 

THE MOVE DOWN TO 4800 SHALL BE A 3 STEP PROCESS.

Thursday, 30 June 2011

HDFCBank Target Met !

On the 31st of May we had given our view on HDFCBank when it was @2275 - and the next day it shot up by 100 Rs. Yesterday HDFCBank shot right through touching a high of 2499 and closing @ 2489
The stock may face strong resistance 2539 and one could short at these levels keeping a stoploss of 2444

Wednesday, 29 June 2011

Thank You So Much


Some people were wondering how to contact us - our email id is timesnifty@gmail.com.
Anyone can email us at anytime and get in touch with us in regard to queries.

TIMESNIFTY  is a free service with no charge. Please feel free to email us and we shall reply within a few hours offering you our opinions and views.

Its just been a month and we have received some very good traffic. We believe with 3814 pageviews in a month and traffic from India, United States, UK, Germany, Malaysa, France, Kuwait, Saudi Aabia, we think we have been able to offer resourceful views that hopefully have profited investors in this short span.
 Thank You everyone for your emails your queries. We out here are much proud that we could help you. 

Monday, 27 June 2011

Nifty Strategy June 27- July 1st

We had predicted a trend change on the 24th of June 2 days before it actually happened. The market had closed with a bullish engulfing pattern on thursday followed by a 150 points shootup in Nifty.

This week the markets should react to a hike in diesel and LPG prices, the Greek debt concerns and US economic data. Taking the high of 5605 and low of 5195 the markets retraced back 23.6% and within another 3 trading sessions the market has covered and moved up to the 61.8% mark.
Option traders may assume short positions at 5520 levels for targets of 5430 -5350 and 5280.
Overall we are ot recommending any buying in this market. One should wait for the markets to come down to decent levels before initiating any fresh  position.

Intraday call for monday markets may rally to higher levels - buy @ 5440 for targets for 5510-20
buy put options in case markets reach or touch higher levels of 5520-40 

Thursday, 23 June 2011

Thursday Nifty Trading Call 23/6/2011


TODAY NIFTY SHALL OPERATE IN THE RANGE OF 5300 AND 5240 IN A DOWNTREND   

SELL NIFTY @ 5290-5300 LEVEL TARGET IS 5240-5220.
                  
Resistance 1Resistance 2Resistance 3Resistance 4Resistance 5
5310.7653295347.265365.565383.89
Support 1Support 2Support 3Support 4Support 5
5256.255238.145220.065202.015184


Wednesday, 22 June 2011

Intraday Strategy for June 22nd


Nifty shall operate in the range of 5180-5310 level in a downtrend.

Sell NIFTY at 5300-20 levels keeping stoploss at 5335 target is 5200 -5180

June 24th could be the date where the trend changes.


Resistance 1Resistance 2Resistance 3Resistance 4Resistance 5
5310.7653295347.265365.565383.89
Support 1Support 2Support 3Support 4Support 5
5256.255238.145220.065202.015184

Tuesday, 21 June 2011

Intraday Strategy for June 21st

Nifty today should trade in the range of 5180 - 5300
Traders could select positions accordingly.
1. If Nifty opens near 5200 buy near 5190-5210 levels Target 5280-5300
2. If Nifty opens near 5300-10 levels sell for a target of 5230-40


Resistance 1Resistance 2Resistance 3Resistance 4Resistance 5
5292.565310.7653295347.265365.56
Support 1Support 2Support 3Support 4Support 5
5238.145220.065202.0151845166.01

NIFTY's Broken Shoulder :(


The closing today formed a complete head and shoulder pattern for Nifty. The Neckline (5350) was broken rather pretty quick. We see the next level of support at 5177 levels and after that nifty has support at 4800 levels.
The Neckline which was a Support shall  now play the role of Resistance.
The head and shoulder pattern does give an initial bounce back towards its neckline, so a short term target of 5340-60 can be expected from lower levels.


Sunday, 19 June 2011

RELIANCE INDUSTRIES - " Make it OR Break it "

Everybody likes cheap stocks which promise to deliver in a short time span. Right now we dont need to look far to find one as one of the biggest companies is available at a 52 WEEK LOW. Reliance Industries has taken a constant beating by the investors and bears on speculations of companies strength to perform and deliver to its investors as one of the largest companies in the world.


The purpose of the chart is to give a brief and real picture about what a company has been doing overtime. The chart in this case gives us the magnitude of how bearish institutions and retailers have been on this security. As seen on the daily price chart - The stock has already broken its previous support of 880, we see that the last level of trend line support can be found in the range of 855-860. If broken, we could see the heavyweight take down the entire index along with itself.
The stock has been in a consolidation phase for the last 2 years moving sideways but losing its grip and value over time. RIL has especially been a target for short term investors who have continuously bought and sold the security keeping 10-15% margin as profits.

Keeping in mind our previous post about the NIFTY LEVELS we do expect the markets to go upto 5700 levels. If what we think and if our theory is right we do expect RELIANCE INDUSTRIES to start moving up from this level along with the index.
     
We have recommended a BUY to our clients @ the 850 levels and in our view the stock should again give its investors a 10-15% margin. We however do recommend that after gaining certain profits investors should watch how the markets react at the 5700 levels and sell stocks just to be on the safe side.

SHORT TERM TARGETS 904 , 929, 970 (5700 LEVELS)

Friday, 17 June 2011

Strategies for 17th June

Nifty shall on friday operate in a downward trend.

Sell at 5420 levels SL at 5440 Target 5380-60

Once it hits 5360 levels long positions can be taken for 5440-5460 levels 

Wednesday, 1 June 2011

HDFCBank & NIFTY UPDATE

HDFC BANK blasted today closing at 2399.55 and touched a high of 2408. Although 2 of our targets of 2350 and 2400 have so far been achieved the target of 2475 still remains which we hope to achieve later during the week.
For tomorrows (June 1st) trading session - 
Based on todays close HDFCBank looks good above 2374. If traded above this level for sometime we could see 2433 and above that 2460-65. However maximum profit should be booked at the first level. A strong support stands at 2340.
As per our projections todays High could be 2455 and Low 2357

Regarding our previous post of Nifty triangulating to 4800 on the 26th of May, we had hit a low of 5328 and closed at 5348. Since then Nifty has gained  212 points in 4 trading sessions and closed at 5560 on the 31st of May. 
However we would like to point out that the corrective B wave consists of 3 sub-waves. We may experience some sort of a correction in the coming trading sessions before hitting 5650-5690 levels. A very strong resistance is seen at 5700 levels where we think the Nifty shall eventually give traders the final exit chance. 5700 is also the 6th point which concurs the symmetrical triangular pattern.
Please be advised if any kind of actions or short positions are assumed work with a strict STOP LOSS. 

Tuesday, 31 May 2011

Technical Call on HDFC BANK


Using a very simple and conventional technical technique - we now see that the 5 DMA and 10DMA  have started to rise over the 20 DMA - the simple rule generates a buy signal when the smaller moving averages are above the larger moving average and triggers a sell/short signal when the smaller moving average goes below the larger or 20 DMA. The application uses a variation of 5,10 and 20 DMA.

As we can see MACD has also generated a buy signal for HDFC BANK.

The equity has been finding and using 2275 as a support line. Short term call or target for HDFC BANK stands at  2350, 2400 and 2475

Thursday, 26 May 2011

Are we Triangulating to 4800 ??


On the 25th of May, we discussed the possiblillity of the Nifty coming within a symmetrical triangular pattern. As assumed the Nifty did touch a low of 5328.7 yesterday and rebounded back to close on at 5348.95 
As I write Nifty today has rebounded and has been trading @5398 at 1137 AM. 
The common rule requires 2 major confirmations before the assumption of a symmetrical triangle.
1. The second high should be  lower than the first high with the upper line sloping down.
2. The second low should be higher than the first low and the lower line should slope up.
The pattern generally forms with 6 points before a break out occurs.  

Drawing major trendlines our upper limit before a down trend begins would be 5660-5690 . A short position could be assumed with a stop loss of 5750

With an Elliott Wave Outlook  the rally from 5177  (WAVE C) was described as an ‘X’ wave separating two sets of three-wave down moves. We should now definitely try to hold 5600-5650 as a safe haven and exit positions on every recovery to sell before a move down to 4800