The Indian Stock Market Enterprise has been continuously trying to open the markets way ahead of its league only to watch it come down with in a matter a minutes back to levels where it actually belongs.
We did a research on our top 5 indicators which generally signal a trend change cautioning investors that what may look gloomy is actually intriguing.
We added some more simpler explanations for readers to understand exactly what these mean
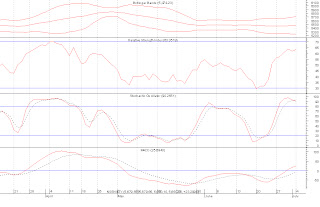
The RSI is now at 63.35 where 30 is considered a buying level and 70 a selling level.
The stochastic Oscillator is now at 90.25 where 80 is considered overbought and 20 oversold.
The MACD has NOT yet triggered the sell signal but is close and we do expect that to happen within the next 2 trading days.
The Bollinger bands as we can see are not giving a very clear picture of what we could expect but definitely seem to be closing in pretty fast.
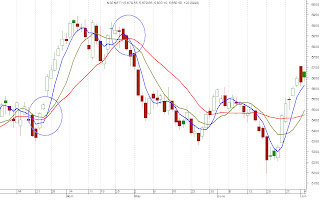
We also drew up a chart combining the 20-10-5 DMA. The chart has very simple rules
TimesNifty - July 5th 2011
We did a research on our top 5 indicators which generally signal a trend change cautioning investors that what may look gloomy is actually intriguing.
We added some more simpler explanations for readers to understand exactly what these mean
The RSI is now at 63.35 where 30 is considered a buying level and 70 a selling level.
The stochastic Oscillator is now at 90.25 where 80 is considered overbought and 20 oversold.
The MACD has NOT yet triggered the sell signal but is close and we do expect that to happen within the next 2 trading days.
The Bollinger bands as we can see are not giving a very clear picture of what we could expect but definitely seem to be closing in pretty fast.
We also drew up a chart combining the 20-10-5 DMA. The chart has very simple rules
- When the 20 DMA crosses over the 10DMA & 5 DMA it means the market is losing momentum and losing steam. (look at circle 2 above May)
- When the 20 DMA goes under the 10 & 5 DMA it means the heat is building up and the bulls are taking charge. The market is rather gaining momentum quickly and its time to buy.
- the Stochastics in April end / May peak was at 72,
- the 20 DMA crosses over the 10&5 DMA,
- the MACD generated a sell signal 4 days before the trend changed and
- the RSI was at 65.
We had way too many signs of CAUTION and yet here we have it again.
TimesNifty - July 5th 2011


In the Fibonacci Retracements chart - 5th line 4th word should be " now " not "not" ! please Omit the error, came to our attention pretty late.
ReplyDeleteSorry about it !
You may simply edit the original blog !
ReplyDelete