3 massive explosions have occured in Mumbai last evening. We offer our deepest condolences to families who lost loved ones and prayers for those injured. Lets hope everything returns back to normal soon.
Intraday Nifty Levels
BUY NIFTY ABOVE 5574 TARGETS 5607, 5626 AND 5640
SELL NIFTY BELOW 5572 TARGETS 5550, 5525 AND 5513
Thursday, 14 July 2011


Wednesday, 13 July 2011
Intraday Nifty
For today July 13th the markets could act rather volatile and an unknown trend or pattern may emerge. Trade carefully.
BUY NIFTY ABOVE 5535 TARGETS 5552 , 5568 AND 5587
SELL NIFTY BELOW 5535 TARGETS 5494, 5476 AND 5457
(One should wait and watch for 15 minutes before deciding on a Nifty trend work with a tight stoploss)
SHORT TCS @ 1163 TARGET 1128 -
SHORT SBIN @2420 TARGET 2371
SHORT LT @1800 TARGET 1752 ( our favorite)
BUY NIFTY ABOVE 5535 TARGETS 5552 , 5568 AND 5587
SELL NIFTY BELOW 5535 TARGETS 5494, 5476 AND 5457
(One should wait and watch for 15 minutes before deciding on a Nifty trend work with a tight stoploss)
SHORT TCS @ 1163 TARGET 1128 -
SHORT SBIN @2420 TARGET 2371
SHORT LT @1800 TARGET 1752 ( our favorite)
Monday, 11 July 2011
Let Me See Your Hands, Sir !!
The fall that we had been writing about all last month has finally started and the Nifty has now started its descent.We had been updating the blog regularly so readers could see for themselves the signals that were generated at levels where we should have cleaned up before the markets cleaned us.
 We are attaching an update on BankNifty as we perceive this Index as building and losing ground and momentum very quickly and rapidly. Among the top 10 heavy-weights of the index SBIN, ICICI, HDFCBank & HDFC hold very significant amount of shares as a percentage to weaken the index.
As for the the other banks;
HDFC & HDFC Bank- RSI, Stchastics, CCI indicators and candlesticks at this point do confirm the stock has changed trends. The security is losing steam pretty fast and quick.
ICICI Bank - The stock has already lost about 6% value in the last 7 trading sessions. Today, the MACD has also generated a SELL signal for ICICI BANK. The stock has a thumbs down and can be shorted at these levels for a decent profit in the next few sessions.
SBIN - The CCI Indicators and the Stochastics generated a sell in SBIN - The RSI has decreased rapidly from 65- 58 in the last 3 sessions which means the security is continously losing volume and is being played by naked shorters for marginal gains.
WE ARE VERY BEARISH ON THESE 4 STOCKS AND BANKNIFTY -
A 20% fall in Banknifty could take the index down very easily by 10%

As for the the other banks;
HDFC & HDFC Bank- RSI, Stchastics, CCI indicators and candlesticks at this point do confirm the stock has changed trends. The security is losing steam pretty fast and quick.
ICICI Bank - The stock has already lost about 6% value in the last 7 trading sessions. Today, the MACD has also generated a SELL signal for ICICI BANK. The stock has a thumbs down and can be shorted at these levels for a decent profit in the next few sessions.
SBIN - The CCI Indicators and the Stochastics generated a sell in SBIN - The RSI has decreased rapidly from 65- 58 in the last 3 sessions which means the security is continously losing volume and is being played by naked shorters for marginal gains.
WE ARE VERY BEARISH ON THESE 4 STOCKS AND BANKNIFTY -
A 20% fall in Banknifty could take the index down very easily by 10%
Thursday, 7 July 2011
Intraday July 7th
Safe shorts for the day
BHEL SELL @ 1962 TARGET 1940
HDFC SELL@721 TARGET 706
HDFCBANK SELL @2568 TARGET 2530
LT SELL @ 1830 TARGET 1796
SBIN SELL@ 2459 TARGET 2419
Please maintain your stoplosses @ 7-8 Rs above the sell levels. These are good targets but it is also the stock market.
BHEL SELL @ 1962 TARGET 1940
HDFC SELL@721 TARGET 706
HDFCBANK SELL @2568 TARGET 2530
LT SELL @ 1830 TARGET 1796
SBIN SELL@ 2459 TARGET 2419
Please maintain your stoplosses @ 7-8 Rs above the sell levels. These are good targets but it is also the stock market.
Wednesday, 6 July 2011
July 6th Intraday

SAFE SHORTS
SBIN - Short @ 2480 Target 2441
BHEL - Short @ 1975 Target 1905
LT - Short @ 1799 Target 1765
HDFCBANK - Short @ 2558 Target 2527
Tuesday, 5 July 2011
Are You watching this ?
The Indian Stock Market Enterprise has been continuously trying to open the markets way ahead of its league only to watch it come down with in a matter a minutes back to levels where it actually belongs.
We did a research on our top 5 indicators which generally signal a trend change cautioning investors that what may look gloomy is actually intriguing.
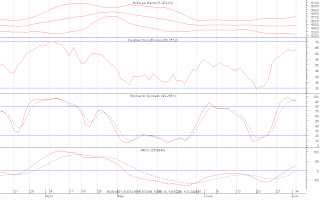
We added some more simpler explanations for readers to understand exactly what these mean
The RSI is now at 63.35 where 30 is considered a buying level and 70 a selling level.
The stochastic Oscillator is now at 90.25 where 80 is considered overbought and 20 oversold.
The MACD has NOT yet triggered the sell signal but is close and we do expect that to happen within the next 2 trading days.
The Bollinger bands as we can see are not giving a very clear picture of what we could expect but definitely seem to be closing in pretty fast.
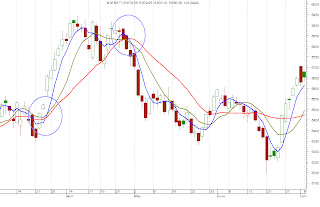 We also drew up a chart combining the 20-10-5 DMA. The chart has very simple rules

TimesNifty - July 5th 2011
We did a research on our top 5 indicators which generally signal a trend change cautioning investors that what may look gloomy is actually intriguing.

We added some more simpler explanations for readers to understand exactly what these mean
The RSI is now at 63.35 where 30 is considered a buying level and 70 a selling level.
The stochastic Oscillator is now at 90.25 where 80 is considered overbought and 20 oversold.
The MACD has NOT yet triggered the sell signal but is close and we do expect that to happen within the next 2 trading days.
The Bollinger bands as we can see are not giving a very clear picture of what we could expect but definitely seem to be closing in pretty fast.

- When the 20 DMA crosses over the 10DMA & 5 DMA it means the market is losing momentum and losing steam. (look at circle 2 above May)
- When the 20 DMA goes under the 10 & 5 DMA it means the heat is building up and the bulls are taking charge. The market is rather gaining momentum quickly and its time to buy.
- the Stochastics in April end / May peak was at 72,
- the 20 DMA crosses over the 10&5 DMA,
- the MACD generated a sell signal 4 days before the trend changed and
- the RSI was at 65.
We had way too many signs of CAUTION and yet here we have it again.

TimesNifty - July 5th 2011
Monday, 4 July 2011
SELL NIFTY OUT !!!
NIFTY INTRADAY
SELL NIFTY 5600 CE @ 140 - TARGET 120 - 95 - 70 STOP LOSS 190
BUY AS PER YOUR APPETITE !!
SELL NIFTY 5600 CE @ 140 - TARGET 120 - 95 - 70 STOP LOSS 190
BUY AS PER YOUR APPETITE !!
Friday, 1 July 2011
RELIANCE INDUSTRIES TARGET MET
On the 20th of June we had posted an article on RELIANCE INDUSTRIES "Make it OR Break it" (link)
Our first Target of 904 was met today - we had recommended the stock for the last run at 840-50 levels ! The stock hasn't moved quite at the pace as we had expected and with nifty touching our target of 5700 we have now recommended our clients to sell for a lesser marginal profit.
Our first Target of 904 was met today - we had recommended the stock for the last run at 840-50 levels ! The stock hasn't moved quite at the pace as we had expected and with nifty touching our target of 5700 we have now recommended our clients to sell for a lesser marginal profit.
NIFTY 4800 - "You can run but you cant hide "
On Thursday May 26th - we had worked to triangulate a situation of NIFTY hitting 4800
This was the situation as on 26th May.We had emphasised on these special points


This was the situation as on 26th May.We had emphasised on these special points

- Nifty should hit a high of 5690-5700 before starting to collapse again.
- The wave structure is composed of 6 points before it breaks away.
- We had expected 2 sets of 3 wave movements with an X wave in the middle and a high of 5690-5700
However Nifty did break the asymmetrical pattern, formed a head and shoulder pattern (cick on link) but within 3 trading sessions we were back in the symmetrical pattern.

Nifty today morning has touched a high of 5705.8 but came back down very quickly. We expect a change in trend to start this coming week. Gann angels show a change in trend on the 6th of July but we could see consolidations as early as starting monday the 4th.
These are safe positions where short positions can be assumed. We had mentioned earlier to watch very closely what Nifty does @ this stage.
THE MOVE DOWN TO 4800 SHALL BE A 3 STEP PROCESS.
Subscribe to:
Posts (Atom)