Tuesday, 5 June 2012
Tuesday, 27 March 2012
Wednesday, 14 March 2012
ALSTOM, M&M AND TATACOMM
ALSTOM PROJECTS (APIL) HAS BREACHED MAJOR HURDLES AND INDICATORS SHOW A BIG JUMP IN A SHORT TIME - CMP 396 SL OF 379 TARGET 460
M&M - MM IS TRADING ALMOST 3 % UP TODAY AND A CLOSE AT THE SIMILAR LEVELS SHOW THAT A MORNING STAR FORMATION MAY GIVE IT THE SENTIMENTAL BOOST IT HAS LACKED IN LAST 3 TRADING SESSIONS. STOCHASTICS AND OSCILLATORS SHOW A MOVE UP 780 IN FORESEEABLE FUTURE.
TATACOMM - I HAVE BEEN TRADING TATACOMM UP AND DOWN ALMOST EVERYDAY. WITH BUDGET AROUND THE CORNER COMM CO's MAY GET THE RELIEF THEY HAVE BEEN LOOKING FOR. BUY WITH A SL AT 222 FOR TARGET OF 280-90
Tuesday, 6 March 2012
Monday, 5 March 2012
Thursday, 1 March 2012
Monday, 27 February 2012
Wednesday, 8 February 2012
Tuesday, 7 February 2012
NIFTY INTRADAY TRADING STRATEGY 02/07
Trade long if Nifty breaks 5400 (spot) for target of 5422, 5435 with a SL @ 5377
Trade short below 5360 for targets of 5330. 5305 and 5290 with a SL @ 5385
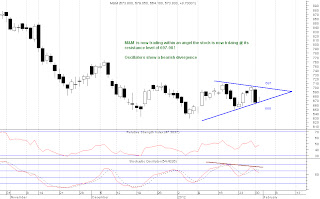
M&M managed to breakout out its resistance and oscillators show an up-move. Buy Intraday for targets of 725-730
Buy above: 715.56 Targets: 721.9 - 728.63 - 735.39 - 742.19
Stoploss : 708.89
Sell below: 708.89 Targets: 702.6 - 695.98 - 689.4 - 682.85
Stoploss : 715.56
Monday, 6 February 2012
NIFTY TECHNICALS WEEK 6
The ruppee showed some amazing strength falling from 54 to 48.9 in just about a month. So, the ruppee jumps to 54 , government approves 100% FDI independent investments and markets rise.
So you send $100 to India @ 54 = 5400 RS. Buy back @ 49 = $110.2
Gain = 10%
Not bad for a months work.
Now who else could import dollars into during such times could be your own guess. But what I would worry about is what the politicians will now do to keep this money in the country before outflow starts.
How about USD/INR = 56 or 58 ? MONEY STAYS !!
I would like to emphasize on the 50 % Gann retracement levels assuming the high of 6338 and a bottom of 4531 . 50% retracement level comes in at 5434
If we analyse the wave theory assuming that we are already in wave 5 a possible termination for wave 5 at the 50 % level comes at 5422. The 3rd wave is now considered as extended and hence we should look for a normal impulse wave.
I am personally very bearish this week. Even though the US jobs and unemployment data has improved investor sentiment lets not forget that the EU bailout deal may steal the limelight and Greece as of now is not succumbing to the restrictions being imposed by the higher councils.
5420 - 50 now should be watched very carefully and no trades should be executed at these levels.
NIFTY WEEKLY
Thursday, 2 February 2012
Wednesday, 1 February 2012
Tuesday, 31 January 2012
Sunday, 29 January 2012
NIFTY TECHNICAL OUTLOOK FOR WEEK 5
Stocks marched higher last week on the RBI's cut in the banking reserve ratio and the US Fed's promise to keep its zero interest policy intact into 2014. The policy reaffirmed the pessimistic outlook of Ben Bernanke for the American economy. The Indian index has now gained about 12.5 % in January and the FII's have pumped in Rs 8000 cr into the markets. The bulls have now managed to push NIFTY towards its 200 DMA last week.
DIVERGENCES
If NIFTY manages to remain above the 5200 level this week the next resistance level would be @ 5400 levels which is the previous high. The momentum would gain strength on a close above 5285. The markets have come a long way in the past 3 weeks. RSI stands at 75 and Stochastics continues its high ride at 95.
NIFTY WEEKLY
The picture shows the NIFTY weekly and daily resistance levels . A week long consolidation is now expected at this level. A close below 5120-30 levels could be considered a good shorting position.
Now because the 20 DMA has crossed the 50 DMA, I would wait for 5160 levels to be attained.
Good stocks for intra-day longs would be TCS and M&M :)
FIBONACCI RETRACEMENT
The index closed exactly at the 78.6 % retracement levels and has a hanging man candlestick. This somehow is starting to give me a feel that there may not be much upside left and we may see a dull and boring week coming ahead.
Sunday, 22 January 2012
NIFTY TECHNICAL OUTLOOK FOR WEEK 4
The markets moved up a whopping 3.8 % last week and overall just during the month of January Nifty has gained more than 9%. We had initially anticipated a move upto 4894 but a move so strong upto 5066 was frankly very unexpected. The target blended very quickly with all the incoming positive news and inflow of more than a Billion Dollars into the economy. The markets even disregarded the S&P Downgrade of France and the other nations.
The Golden Ratio of 61.8%
Corrective or Impulsive wave ?
A typical wave 3 is a normal wave if it retraces upto 161.8 % levels of wave 1 which is 5020. The wave 4 retraces upto 23.6% and 38.2% of wave 3 so watch the markets very carefully at these levels and one shall know if we're headed back down or up. A close below 4827 shall confirm that this is rather a corrective wave and not an impulsive wave.
The NIFTY volumes show that Fibo traders jumped into action at the levels and healthy shorts have been created with a SL of 5100 (7th December high of 5099 shall now act as a decent resistance for the bulls)
Note : The gaps that have been created and formed shall fill pretty quickly once the markets start reacting to the downfall.
Clearly the markets have been overbought for sometime now. Stochastic and RSI both indicate levels of caution but MACD continues to remain in a bullish crossover.
Weekly charts suggest NIFTY now has support at 4827.
Monthly charts suggest that last months high of 5099 now acts as resistance.
The Golden Ratio of 61.8%
Retracement levels from high of 5400 to 4531 is shown in the above chart. 61.8% retracement comes in at 5067. The markets on Friday made a high of 5064.
Corrective or Impulsive wave ?
A typical wave 3 is a normal wave if it retraces upto 161.8 % levels of wave 1 which is 5020. The wave 4 retraces upto 23.6% and 38.2% of wave 3 so watch the markets very carefully at these levels and one shall know if we're headed back down or up. A close below 4827 shall confirm that this is rather a corrective wave and not an impulsive wave.
The NIFTY volumes show that Fibo traders jumped into action at the levels and healthy shorts have been created with a SL of 5100 (7th December high of 5099 shall now act as a decent resistance for the bulls)
Note : The gaps that have been created and formed shall fill pretty quickly once the markets start reacting to the downfall.
Clearly the markets have been overbought for sometime now. Stochastic and RSI both indicate levels of caution but MACD continues to remain in a bullish crossover.
Weekly charts suggest NIFTY now has support at 4827.
Monthly charts suggest that last months high of 5099 now acts as resistance.
Tuesday, 10 January 2012
A Traders Perfect Life @4430
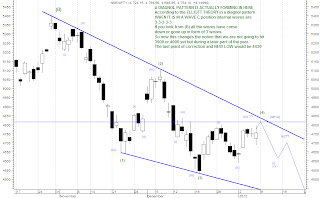
I got a lot of queries over the last week to update my current view on Nifty - However I was waiting for the index's to give me a clearer view of what is really in store for the Indian traders. As I now see it we are entering another correction. (see picture 2) Once the correction is over we would zoom back into the 5200 range but I would not count this as or assume its a wave 1 starting a new cycle. The run upto 5200 could be because of our upcoming budget, steady declining, government posted inflation numbers.. which I think is bullshit, or interest rate cuts. USA on its death bed is posting a constant improvement in economic numbers.
The global eco-politics and looking at whats in store for Europe (deep correction) I would cautiously behold this next wave up to 5200 as another X wave. If I am right about this X wave we would have another set of a-b-c correction and that would take us down to 3800 levels. I would remind all our readers that X waves are generally made up of 3 waves and to keep this in mind before positioning your self long just to see your self drained out of capital. Personally I feel 2012 is going to be worse than 2011.
A problem is never big, it is the small problems that add up to create a big problem. Whoever is viewing this pass it on to your friends, it may help them in someway or the other. :)
Wednesday, 4 January 2012
Nifty Technicals & DLF
DLF
I have recently spotted a wedge formation on the DLF chart for the time being the Stochastics are oversold and the RSI standing @ 41 is now showing a positive divergence. MACD also shall soon converge to generate a buy signal. The stock has also seen volumes increase over the last 5 trading sessions. The stock could definitely now hit 198-200 levels in days to come.
Buy at / above: 189.06 Targets: 192.41 - 195.9 - 199.41 - 202.96 Stoploss : 185.64
Sell at / below: 185.64 Targets: 182.34 - 178.98 - 175.65 - 172.35 Stoploss : 189.06
NIFTY
The Nifty took on a massive rally on Tuesday as we had predicted but our projected high of 4814 has still not been touched. I would remain optimistic about tomorrow although I would start getting bearish or quitely watch what people were doing for a day or 2. The FII's bought 138.97 Crores in cash. The OI in INDEX FUTURES has increased from 406363 contracts (3rd Dec) to 448271 contracts (4th Dec) but they are selling more than they are buying. Ironically Stock Futures OI increased from 980779 to 981231 during which both days they bought more and sold less.
This leaves me with a feeling that the market may open higher and start to fall apart later hence commencing the larger down move as we had anticipated. Refer to our last blog where we had drawn graph that looked like a possibility of what we may see in days to come.
Subscribe to:
Comments (Atom)


