Monday, 27 February 2012
Wednesday, 8 February 2012
Tuesday, 7 February 2012
NIFTY INTRADAY TRADING STRATEGY 02/07
Trade long if Nifty breaks 5400 (spot) for target of 5422, 5435 with a SL @ 5377
Trade short below 5360 for targets of 5330. 5305 and 5290 with a SL @ 5385
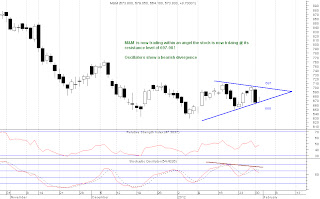
M&M managed to breakout out its resistance and oscillators show an up-move. Buy Intraday for targets of 725-730
Buy above: 715.56 Targets: 721.9 - 728.63 - 735.39 - 742.19
Stoploss : 708.89
Sell below: 708.89 Targets: 702.6 - 695.98 - 689.4 - 682.85
Stoploss : 715.56
Monday, 6 February 2012
NIFTY TECHNICALS WEEK 6
The ruppee showed some amazing strength falling from 54 to 48.9 in just about a month. So, the ruppee jumps to 54 , government approves 100% FDI independent investments and markets rise.
So you send $100 to India @ 54 = 5400 RS. Buy back @ 49 = $110.2
Gain = 10%
Not bad for a months work.
Now who else could import dollars into during such times could be your own guess. But what I would worry about is what the politicians will now do to keep this money in the country before outflow starts.
How about USD/INR = 56 or 58 ? MONEY STAYS !!
I would like to emphasize on the 50 % Gann retracement levels assuming the high of 6338 and a bottom of 4531 . 50% retracement level comes in at 5434
If we analyse the wave theory assuming that we are already in wave 5 a possible termination for wave 5 at the 50 % level comes at 5422. The 3rd wave is now considered as extended and hence we should look for a normal impulse wave.
I am personally very bearish this week. Even though the US jobs and unemployment data has improved investor sentiment lets not forget that the EU bailout deal may steal the limelight and Greece as of now is not succumbing to the restrictions being imposed by the higher councils.
5420 - 50 now should be watched very carefully and no trades should be executed at these levels.
NIFTY WEEKLY
Thursday, 2 February 2012
Wednesday, 1 February 2012
Tuesday, 31 January 2012
Sunday, 29 January 2012
NIFTY TECHNICAL OUTLOOK FOR WEEK 5
Stocks marched higher last week on the RBI's cut in the banking reserve ratio and the US Fed's promise to keep its zero interest policy intact into 2014. The policy reaffirmed the pessimistic outlook of Ben Bernanke for the American economy. The Indian index has now gained about 12.5 % in January and the FII's have pumped in Rs 8000 cr into the markets. The bulls have now managed to push NIFTY towards its 200 DMA last week.
DIVERGENCES
If NIFTY manages to remain above the 5200 level this week the next resistance level would be @ 5400 levels which is the previous high. The momentum would gain strength on a close above 5285. The markets have come a long way in the past 3 weeks. RSI stands at 75 and Stochastics continues its high ride at 95.
NIFTY WEEKLY
The picture shows the NIFTY weekly and daily resistance levels . A week long consolidation is now expected at this level. A close below 5120-30 levels could be considered a good shorting position.
Now because the 20 DMA has crossed the 50 DMA, I would wait for 5160 levels to be attained.
Good stocks for intra-day longs would be TCS and M&M :)
FIBONACCI RETRACEMENT
The index closed exactly at the 78.6 % retracement levels and has a hanging man candlestick. This somehow is starting to give me a feel that there may not be much upside left and we may see a dull and boring week coming ahead.
Subscribe to:
Posts (Atom)


